

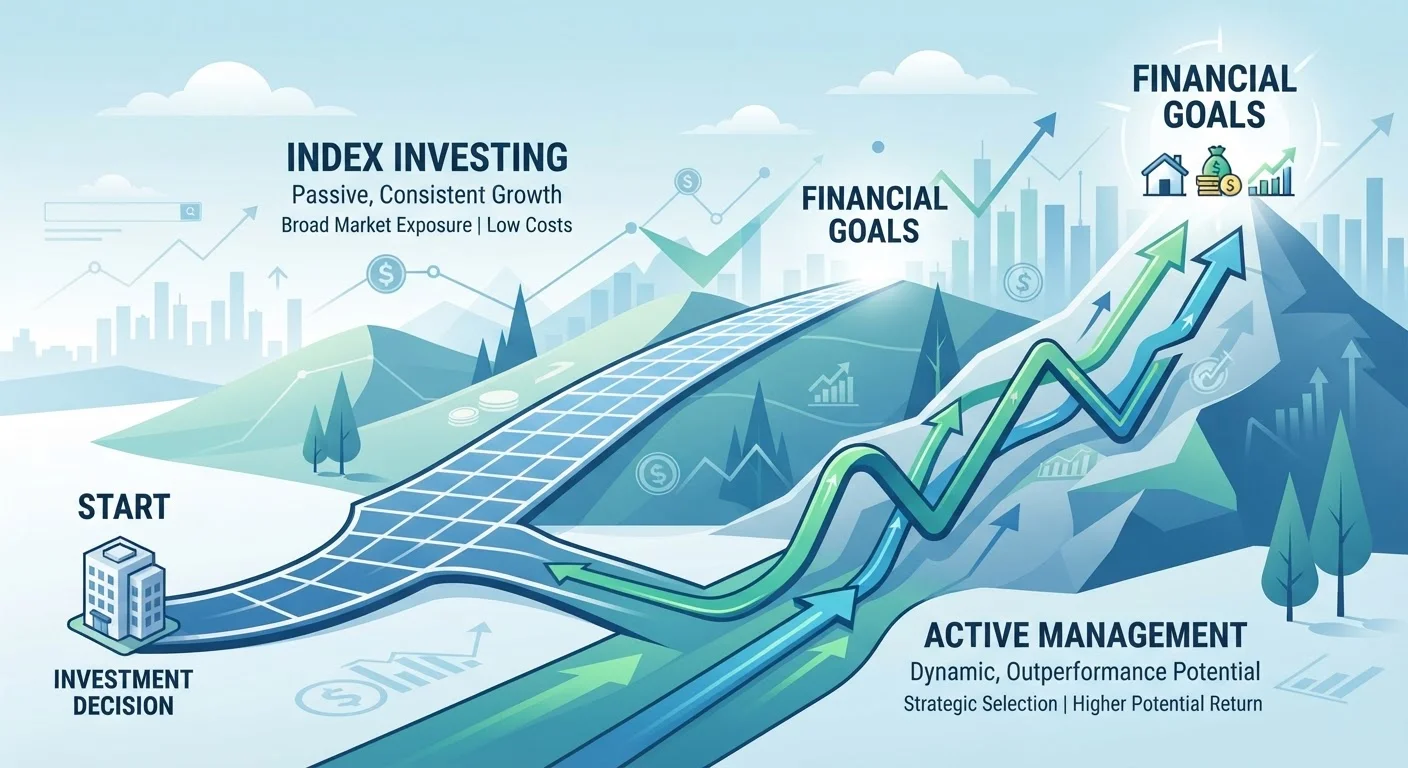
Key Takeaways
Option A
Index Funds
The hands-off, market-matching approach.
Best for: Investors who want broad market exposure, low costs, and minimal ongoing decision-making.
Option B
Actively Managed Funds
The research-driven, beat-the-market pursuit.
Best for: Investors comfortable paying higher fees for a manager's strategy in specific market segments.
If you want a simple, low-cost strategy for long-term wealth building
Index Funds
Index funds offer broad diversification at minimal cost, and decades of data suggest most investors capture more net return this way over time.
If you want exposure to a niche market where active selection may add value
Actively Managed Funds
In less-efficient markets - such as small-cap international equities - skilled active managers may have more opportunity to add value, though results vary and fees still matter.
If minimizing fees is your top priority
Index Funds
Index fund expense ratios are typically a fraction of those charged by active funds, and lower costs directly improve your net return over decades.
If you want a fund that can defensively adjust in volatile markets
Actively Managed Funds
Active managers can shift holdings in response to market conditions, whereas index funds must hold all benchmark constituents regardless of outlook.
How Each Approach Actually Works
An index fund is designed to replicate the performance of a specific market index - such as the S&P 500 or the total U.S. stock market. The fund holds the same securities as the index, in the same proportions, and does very little trading. Because there is no manager making active decisions, costs stay low and the fund's performance closely mirrors the index itself, minus fees.
An actively managed fund employs a portfolio manager - or a team - whose job is to select securities they believe will outperform the market. They conduct research, monitor economic trends, and make ongoing buy and sell decisions. The goal is to deliver returns above a stated benchmark. Because this requires continuous professional effort, the costs are meaningfully higher.
Understanding this structural difference is the foundation for every other comparison. One approach bets that markets are efficient enough that mimicking them is the smartest move; the other bets that skilled analysis can identify opportunities the market hasn't fully priced in. Both are legitimate theories - they just lead to very different investor experiences and outcomes.
The Cost Gap: Why It Matters More Than It Looks
Fees are one of the clearest differences between these two fund types. Index funds typically carry expense ratios (the annual fee as a percentage of your investment) well below 0.10% for many broad-market options. Actively managed funds often charge 0.50% to over 1.00% annually - sometimes more for specialized strategies.
That gap may sound small, but it compounds dramatically. On a $50,000 portfolio earning 7% annually over 30 years, the difference between a 0.05% and a 1.00% expense ratio can translate to tens of thousands of dollars in foregone returns. Our guide on how fund fees erode investment returns over time explains this compounding effect in detail.
| Criterion | Index Funds | Actively Managed Funds |
|---|---|---|
| Management style | Passive - tracks an index | Active - manager selects securities |
| Typical expense ratio | Under 0.10% for many options | 0.50%-1.00%+ annually |
| Portfolio turnover | Low - minimal trading | High - frequent buying and selling |
| Tax efficiency | Generally higher | Generally lower |
| Performance goal | Match benchmark returns | Beat benchmark returns |
| Long-term track record vs. benchmark | Consistent with index, minus fees | Most underperform after fees over 15 years |
| Manager flexibility | None - must hold index constituents | Full - can shift based on outlook |
Beyond expense ratios, actively managed funds also tend to generate more taxable events due to higher portfolio turnover - meaning you may owe capital gains taxes sooner in a taxable account. Index funds, with minimal trading, are generally more tax-efficient.
What the Performance Record Actually Shows
The debate between active and passive investing has been studied extensively. S&P Dow Jones Indices publishes a report called the SPIVA Scorecard that tracks how actively managed funds perform against their benchmark indexes. Historically, the data shows that the majority of actively managed funds in most categories underperform their benchmarks over 10- and 15-year periods, after accounting for fees.
This doesn't mean active managers never outperform - some do, sometimes significantly, and for sustained stretches. The challenge for investors is identifying which managers will outperform in advance, and research suggests past outperformance is a weak predictor of future results.
Markets in the U.S. are considered highly efficient, meaning information is priced in quickly and leaving less room for active managers to exploit mispricings. In less-efficient markets - such as certain international or small-company segments - the case for active management is somewhat stronger, though still not guaranteed.
~85%
Active large-cap funds underperforming S&P 500 over 15 years
According to S&P Dow Jones Indices' SPIVA U.S. Scorecard, roughly 85% of actively managed large-cap U.S. equity funds have underperformed the S&P 500 over a 15-year period after fees.
0.05% vs 1%+
Typical expense ratio gap: index vs. active funds
Many broad-market index funds carry expense ratios of 0.05% or less, while actively managed funds commonly charge 1% or more annually, per data tracked by Morningstar.
$30,000+
Potential 30-year cost difference on a $50,000 portfolio
Illustrative calculation: a 0.95 percentage point fee difference on a $50,000 portfolio earning 7% annually compounds to over $30,000 in foregone returns over 30 years.
If you're exploring how to layer this kind of thinking into a broader plan, our overview of asset allocation across life stages provides useful context on how fund choices fit into your overall portfolio strategy.
How to Think About This for Your Own Investing
Most long-term investors don't face an either/or choice. Many use index funds as the core of their portfolio - capturing broad market returns at low cost - and may hold one or two actively managed funds in areas where they believe the manager's strategy adds value.
A consistent, disciplined contribution habit matters as much as fund selection. Our article on dollar-cost averaging explains how investing a fixed amount regularly can reduce the emotional strain of market swings, regardless of which fund type you use.
If you're investing within a retirement account, our comparison of Roth IRA vs. Traditional IRA is worth reviewing - the account type shapes how fees and gains are taxed, which can affect how much the cost difference between fund types ultimately matters to you. And if any of this feels unfamiliar, our guide to common investing myths can help you build confidence from the ground up.
This article is for general informational and educational purposes only. It is not personalized investment advice. Past performance of any investment does not guarantee future results. Please consult a qualified financial adviser before making decisions about your own investments.