

Key Takeaways
Why the Label Matters - and Where It Starts
The Nutrition Facts label is a federally regulated tool standardized by the U.S. Food and Drug Administration (FDA). Its current format, updated in 2020, was redesigned to reflect what nutrition science has learned about diet and health. Learning to read it accurately puts you in control of your food choices rather than at the mercy of front-of-package marketing claims.
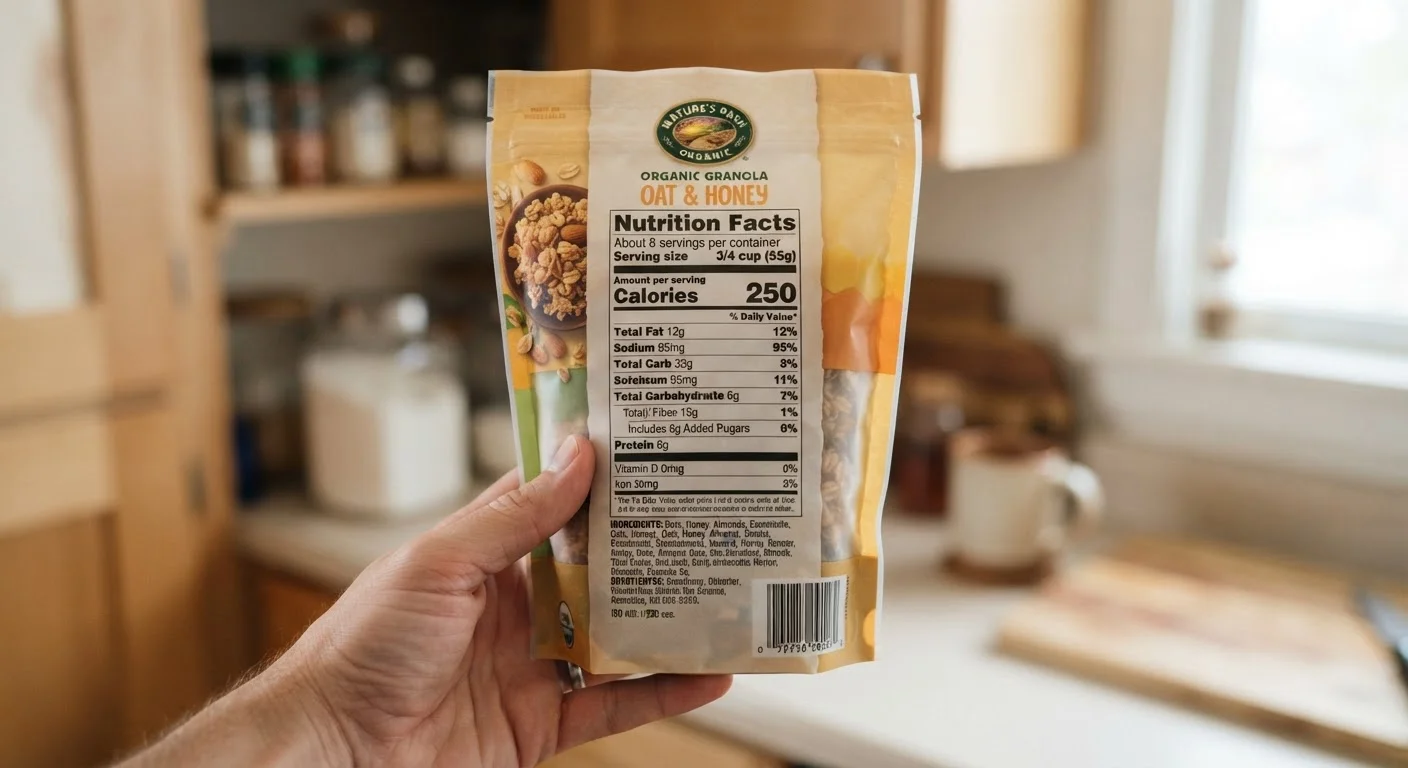
Every analysis of the label begins at the same place: serving size. This figure tells you the standardized amount the manufacturer used to calculate every nutrient value on the panel. It's expressed in a common household measure (such as cups or pieces) alongside a gram weight. Critically, the serving size reflects what people typically eat - not necessarily what a dietitian would recommend. If you eat twice the listed serving, you consume twice the listed calories, fat, and sodium.
Directly below serving size is calories per serving, printed in large type. This is the total energy from all macronutrients in that serving. Calorie awareness is useful context, but it's far from the complete picture of a food's nutritional value, as nutrition science increasingly recognizes.
Breaking Down Nutrients, Daily Values, and the Ingredient List
Below the calorie count, the label is divided into two functional groups of nutrients.
Nutrients to Limit
These appear first and include total fat (broken into saturated and trans fat), cholesterol, and sodium. Consuming these in excess is associated with increased risk of cardiovascular disease and other chronic conditions, according to established dietary guidelines. Trans fat should be as close to zero as possible; even a small declared amount may represent a real trace quantity due to rounding rules.
Nutrients to Prioritize
The lower portion lists dietary fiber, total sugars, and added sugars - a separate, bolded line that was added in the FDA's 2020 update. This distinction matters because naturally occurring sugars (such as those in milk or whole fruit) come packaged with fiber, vitamins, and minerals, whereas added sugars contribute energy with little nutritional benefit. For a deeper look at where added sugars hide, see our guide on added sugar in everyday foods.
Also listed are protein, vitamin D, calcium, iron, and potassium - nutrients that Americans commonly under-consume. For a broader view of what these and other micronutrients do in the body, our micronutrients reference provides useful detail.
Percent Daily Value (%DV)
The right-hand column shows %DV - how much a given nutrient in one serving contributes to a total daily intake based on a 2,000-calorie reference diet. The FDA's practical rule of thumb: 5% DV or less is low; 20% DV or more is high. Use %DV to compare similar products and to gauge whether a food is a meaningful source of a nutrient you want more - or less - of.
The Ingredient List
Ingredients are listed in descending order by weight. Whatever appears first makes up the largest proportion of the product. Scan the first three to five ingredients for the clearest signal of what a food is primarily made of. Multiple names for the same substance - corn syrup, dextrose, maltose - can appear separately, each lower on the list, even when their combined amount is significant.
Compare Products Side by Side
The %DV column is especially powerful when you're choosing between two similar products - a loaf of bread, a can of soup, a box of cereal. Align the serving sizes first (adjust if they differ), then compare %DV for saturated fat, sodium, fiber, and added sugars. Within seconds you can identify the nutritionally stronger option without needing to do any math.
Once you're comfortable reading labels, putting that knowledge into practice at mealtimes is the next step. Our balanced plate guide shows how to apply these fundamentals without calorie counting. And don't overlook beverages - how what you drink shapes how you eat is an often-overlooked part of the nutrition picture.
This article is for general informational and educational purposes only and is not a substitute for personalized medical or dietary advice. Consult a registered dietitian or qualified healthcare professional before making significant changes to your diet.